I was doomscrolling on Instagram after work as always, and between the Tyrese Haliburton edits and posts of sea lions dancing, I came across a video talking about something called Benford's Law. In 30 seconds, it summed up Benford's Law as follows: In many datasets, the most likely first digit of any number is 1, then the 2nd most likely first digit is 2 and so on, with 9 being the least likely digit. It then went on to claim that things like the populations of countries around the world, lengths of rivers, or even income in any given country follow this law. Thinking about it quickly, it didn't seem to make sense. Wouldn't each number have an equal chance of being the leading number? Naturally, I decided to waste a few hours of my life researching this.
The Formula
I'm not going to try to explain how to derive the formula from scratch (there is a really good explanation here), but the following equation gives you the probability that any digit will be the leading one in a data set:
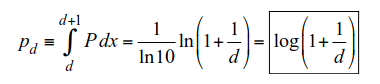
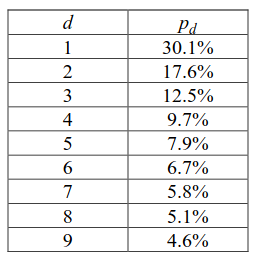
It is surprisingly simple. The probability of digit “d” being the leading digit is given by the formula. The calculated probabilities are listed below
Why Does This Happen?
An intuitive explanation is that when we count, we start with lower values. Because of this, they occur more frequently as the leading digit. For example, if we were to take a random number from 1 to 9, each digit has the same chance of appearing. However, if we take a random number from 1 to 20, we now “boost” our chance of finding a 1 as the leading digit (everything from 10 to 19). Then, from 20 to 29, we “boost” the odds we will have a 2 at the start. This happens to every digit in order, until we reach 99. After that, the next hundred numbers will start with 1. And then the next hundred will start with 2, and so on. Then after 999, the next thousand numbers will begin with 1. Because 1 will always be the first digit to get that “boost” we will be more likely to find it at the start of a number. Same with 9, because it's the last number to get that “boost”, it is the least likely number to be the leading digit.
A more rigorous explanation is that when the fractional parts of the base 10 logarithms of the data are evenly distributed inside the interval [0,1], the data will conform to Benford's Law. For example, we know that 52384 starts with a 5 because log(52384)= 4.72, and 0.72 falls in between log(5)=0.69 and log(6)=0.78, and we know that a number x starts with digit d if and only if log(d) ≤ log(x) < log(d+1). We can relate this reasoning to the above equation with the equivalency log(d+1)-log(d)=log(1+1/d). Since numbers in the real world tend to be distributed uniformly on a logarithmic scale, we can find that this law applies to many datasets.
Benford's Law only applies to measured data, not assigned, and is best observed when we have a dataset where the data spans multiple orders of magnitude. For example, since the population of a country can be anywhere from ~500 citizens (Vatican City), to 1.4 billion (India), we can easily see how it follows that law. This is the same reason why it wouldn't work on a dataset of human heights. It doesn't span multiple orders of magnitude, and the overwhelming majority of people are somewhere between 100cm and 199cm.
Because of this, analysts have used this law to look for fraud in financial records. When people manipulate data, they tend not to track the distribution in the frequency of leading digits, causing faked data to deviate from the naturally occurring Benford's Law.
However, Benford's Law doesn't always apply to every dataset. This blog also points out that Benford's Law doesn't work in places you would expect it to. For example, while it applies to stock prices, it does not apply to Bitcoin prices. Conversely it can apply to datasets where it shouldn't. An example of this is that we can observe the law in address numbers, even though those are assigned.
Testing It Myself
Even with all of this proof, this concept felt off to me, so I figured I should test it. There's a great interactive website here that lets you visualize many datasets to see if Benford's Law applies to them, but I wanted to test it myself. The first step was to find a dataset that I thought Benford's Law would apply to. I was recently looking at the salary of NBA players after the Bucks horrendously overpaid Myles Turner, so the NBA salaries dataset was right there for me to use (Thank you basketball-reference). I grabbed every player's current guaranteed salary, and wrote a quick python program to go through the data and plot it. Here is the result, along with points on the graph showing what the expected value should be if it exactly followed the law.
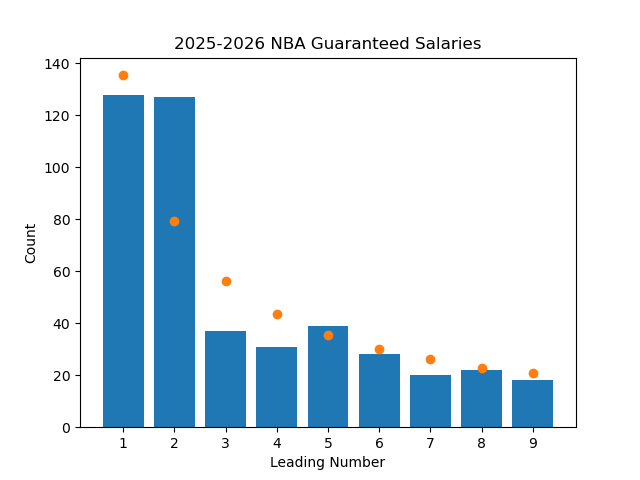
As we can see, besides 2 being a lot higher than predicted, everything else seems to loosely follow Benford's Law. If I had to guess why so many salaries start with a 2, it's because the minimum contract in the league is around 2 million dollars, so it would disproportionately be represented in the data. Max contracts are also dictated by the league, and teams are bound by the salary cap. This constrains the data, making this dataset potentially not the “purest” to test this on.
A cool feature of Benford's Law is that the probabilities are invariant under a change of scale. This means that no matter what scale we use to measure the data, the law should still hold. So I converted the salaries to different currencies and retried the test.
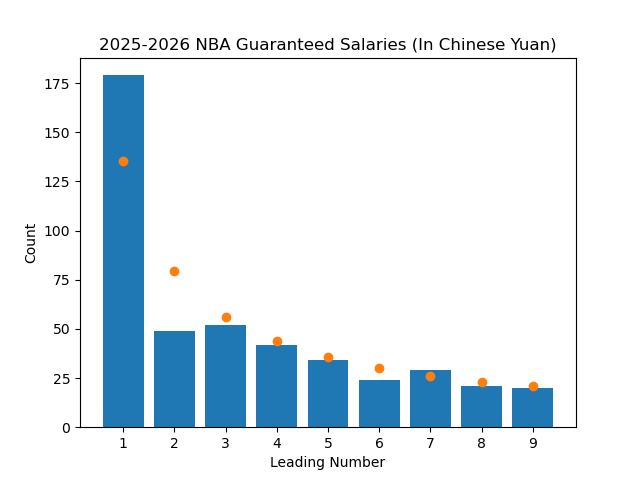
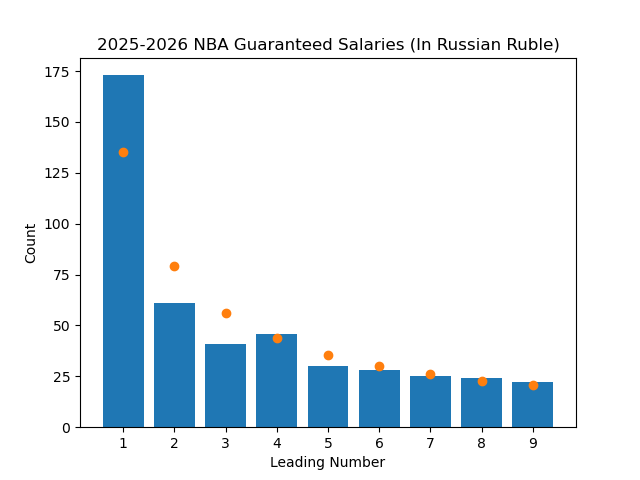
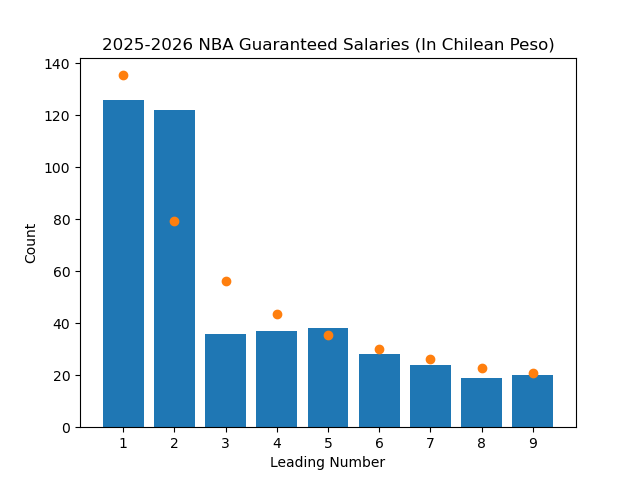
We can see that even after changing currencies, the data still (mostly) follows the law like we would expect it to.
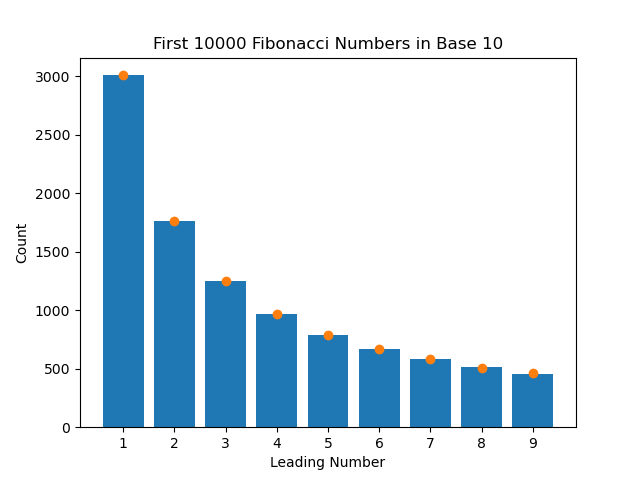
There is one final thing I wanted to test. Theoretically, this invariance would also apply if we changed what base we used to calculate the salaries from base 10 to base 16 (or any base). I wasn't entirely sure if it would work, so I decided to pick a different dataset that more closely followed Benford's Law in base 10 so that it would be obvious whether or not it worked in base 16. It turns out that the numbers in the Fibonacci Sequence follow the law very closely. They also span many orders of magnitude, making them great for this test. I ran the test two more times; once with the first 10000 numbers of the Fibonacci Sequence in base 10, and then the same numbers in base 16.
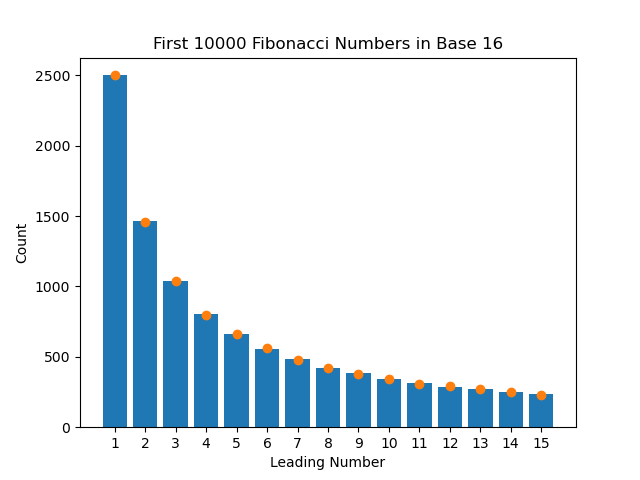
And it fits perfectly. It's pretty neat to see how math permeates every aspect of life. I will now subconsciously be looking for this pattern in every dataset for the rest of my life, like in Instagram follower counts, road trip distances, or even Pacers contracts.